Appearance
Dashboard
The Dashboard is your operational snapshot — the state of orders, revenue, customers, inventory, and coupons, usually over this month or a custom range you pick. It is the page you open first thing in the morning to answer "how are we doing?".
For visitor behavior, conversion funnels, and traffic sources, head over to Analytics — the two sections live side-by-side in the admin sidebar and are deliberately kept separate.
The Dashboard section
All tabs share the same header:
- Refresh button — invalidates client-side caches and re-fetches every number you see. A 30-second cooldown prevents accidental rapid clicks.
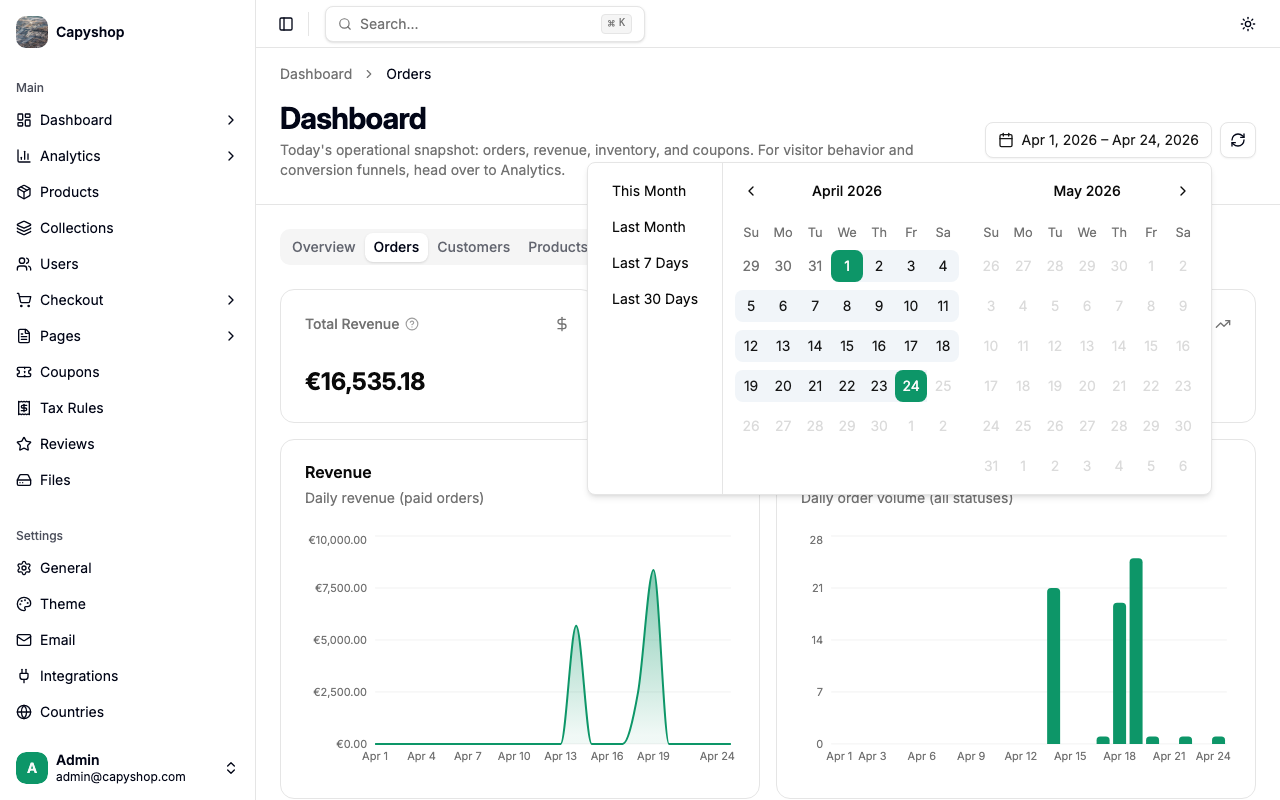
- Date range picker — visible on every tab except Overview. The Overview tab is intentionally fixed on "right now" data. Other tabs default to this month and remember your choice as you switch between tabs.
Overview tab
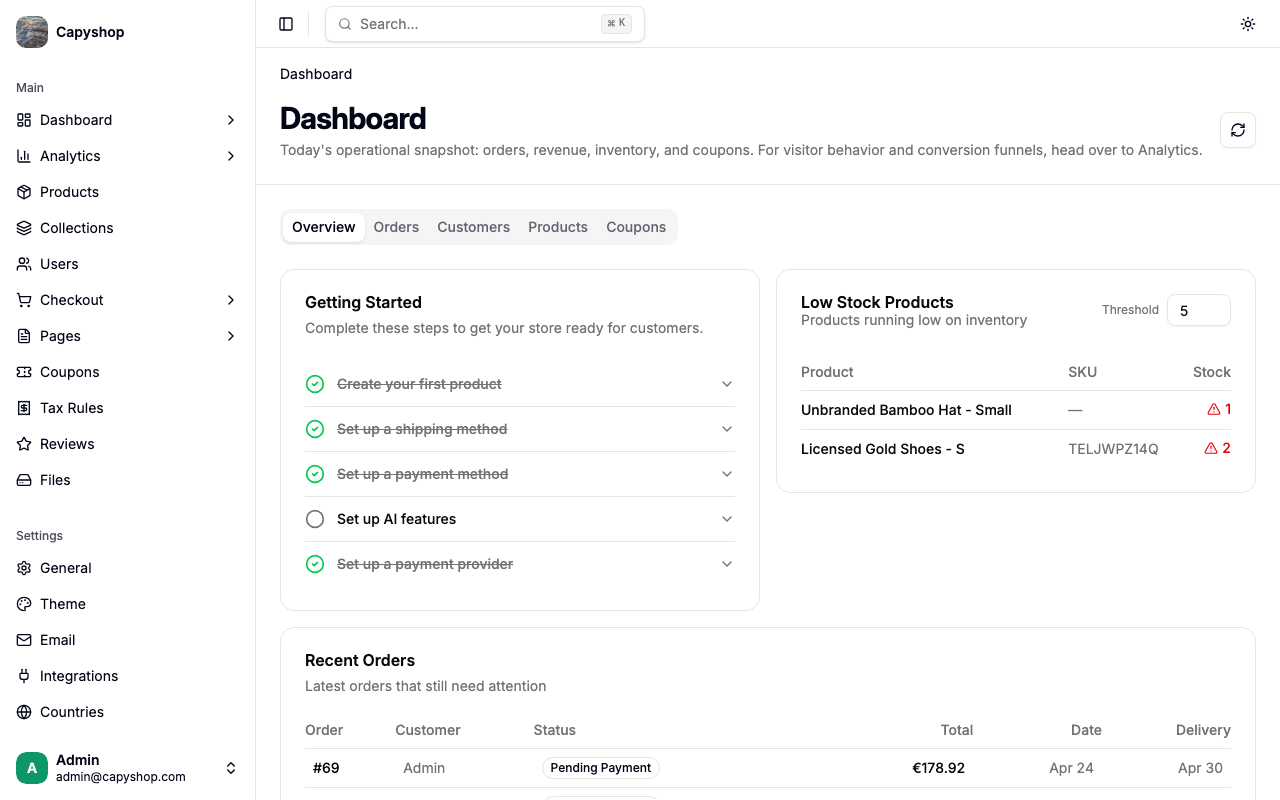
The Overview is designed to be scannable in a few seconds.
- Getting Started — a checklist of what still needs to be set up for your store to launch (first product, shipping, payment methods, AI features, payment provider). Steps are struck through as you complete them; the whole card disappears once everything is done.
- Low Stock Products — products running low on inventory. The Threshold input (default 5) lets you change what "low" means without leaving the page.
- Recent Orders — latest orders that still need attention (unpaid, pending shipment, etc.).
Orders tab
The Orders tab is where most of your operational decisions happen.
| KPI | What it means |
|---|---|
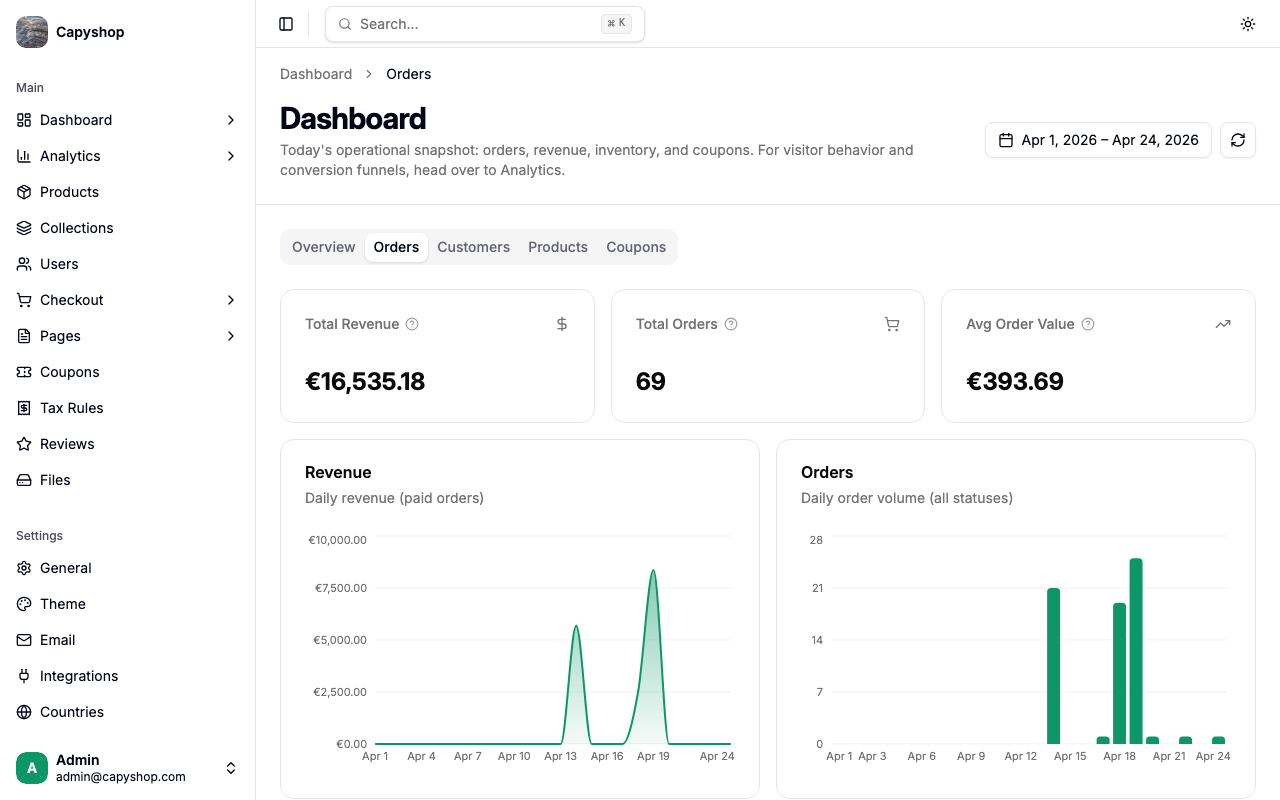
| Total Revenue | Sum of paid, shipped, and delivered order totals in this date range. Pulled straight from your orders table. |
| Total Orders | Count of orders placed in this range, across all statuses (including cancelled and pending). |
| Avg Order Value | Total revenue divided by paid orders. A higher AOV means each customer spends more per checkout. |
Below the KPIs you get four visualizations:
- Revenue — daily revenue area chart (paid orders only).
- Orders — daily order volume bar chart (all statuses).
- Order Funnel — Carts created → Orders placed → Paid → Shipped → Delivered. A quick view of how many carts survive each operational step.
- Order Status — breakdown table showing the share of orders per status (Paid, Pending Payment, Cancelled, etc.).
Customers tab
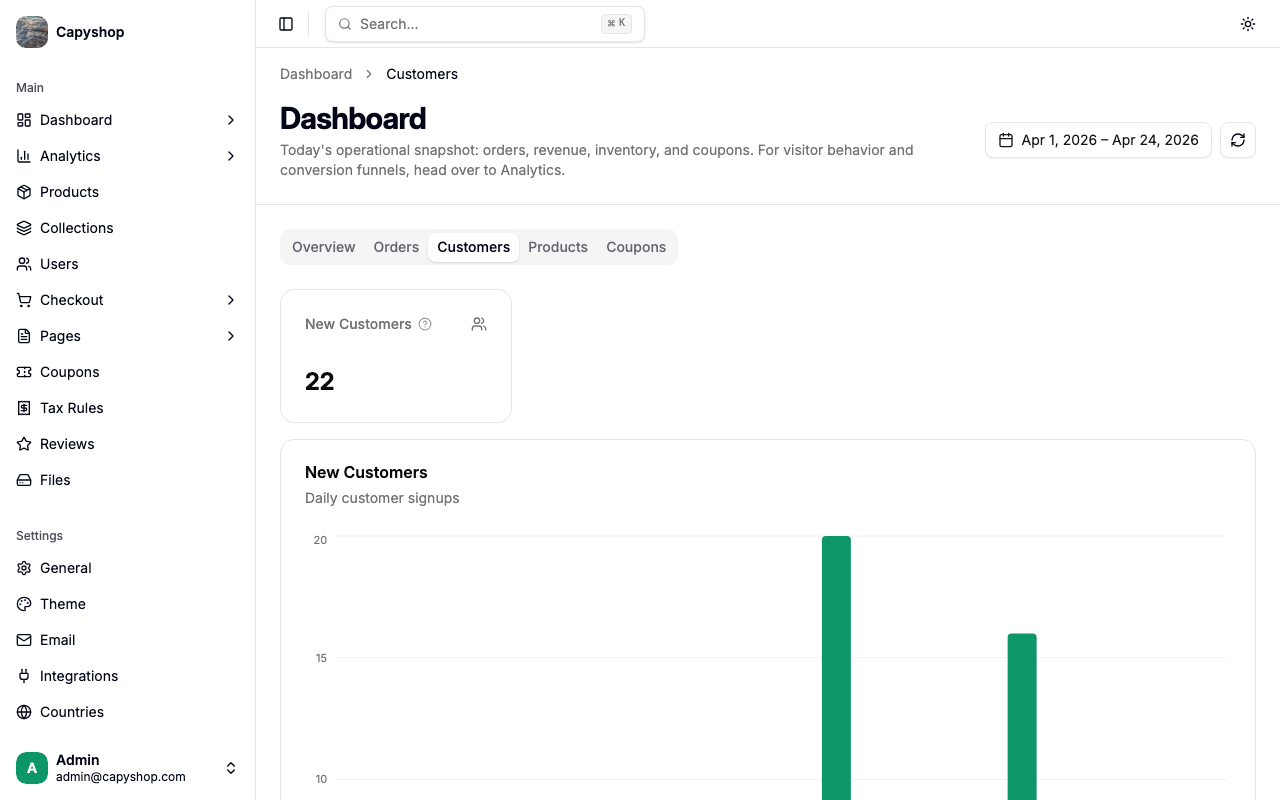
- New Customers — customer accounts created in this date range. Does not include existing customers making repeat purchases.
- Customers chart — daily signups over the range.
This tab gives you a quick sense of how fast your customer base is growing. Pair it with the Conversion Rate KPI on the Analytics overview to see if new traffic is becoming real accounts.
Products tab
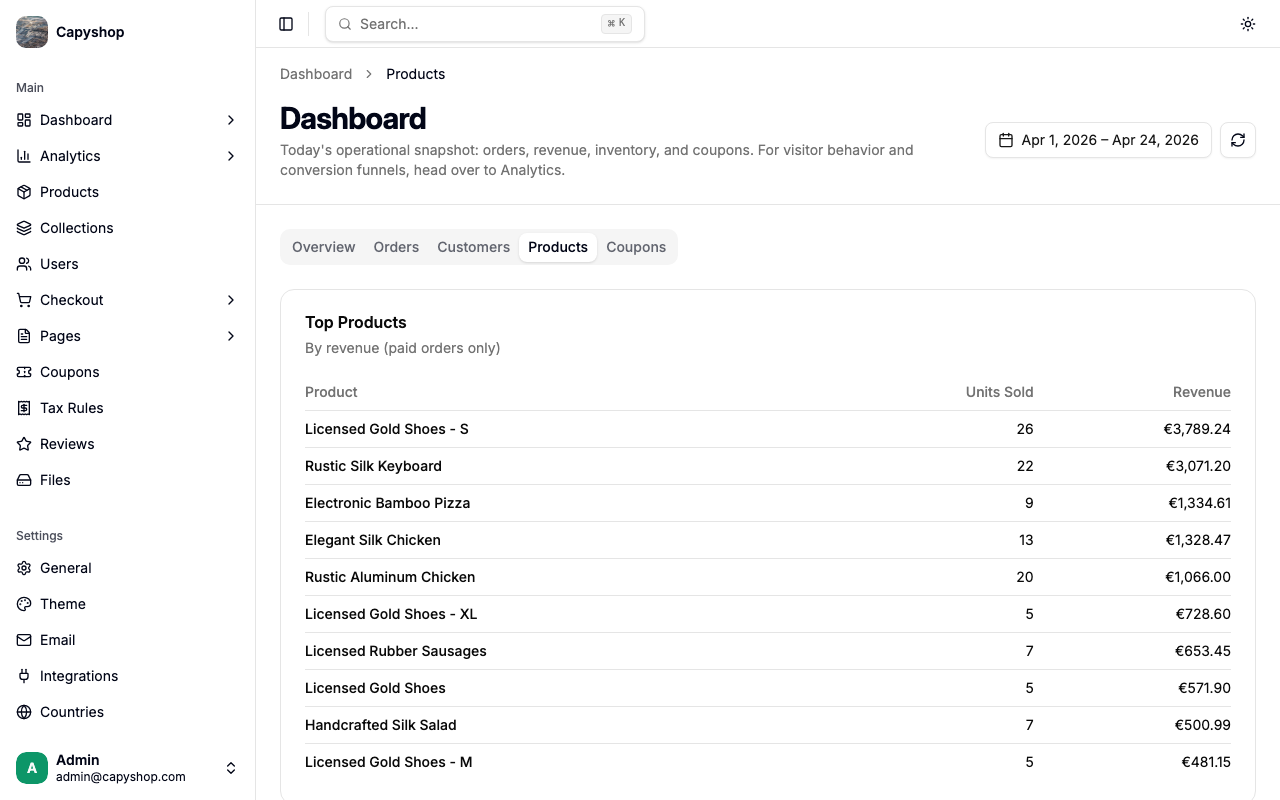
Two tables sit side-by-side:
- Top Products — ranked by revenue in the selected date range (paid orders only). Each row shows units sold and revenue.
- Most Wished Products — products saved to customer wishlists most often, all-time. This table intentionally ignores the date range because wishlist signal is valuable over long periods.
Use the combination to spot what sells vs. what is only aspirational — a product with lots of wishlist saves but low revenue might need a price review or a promo.
Coupons tab
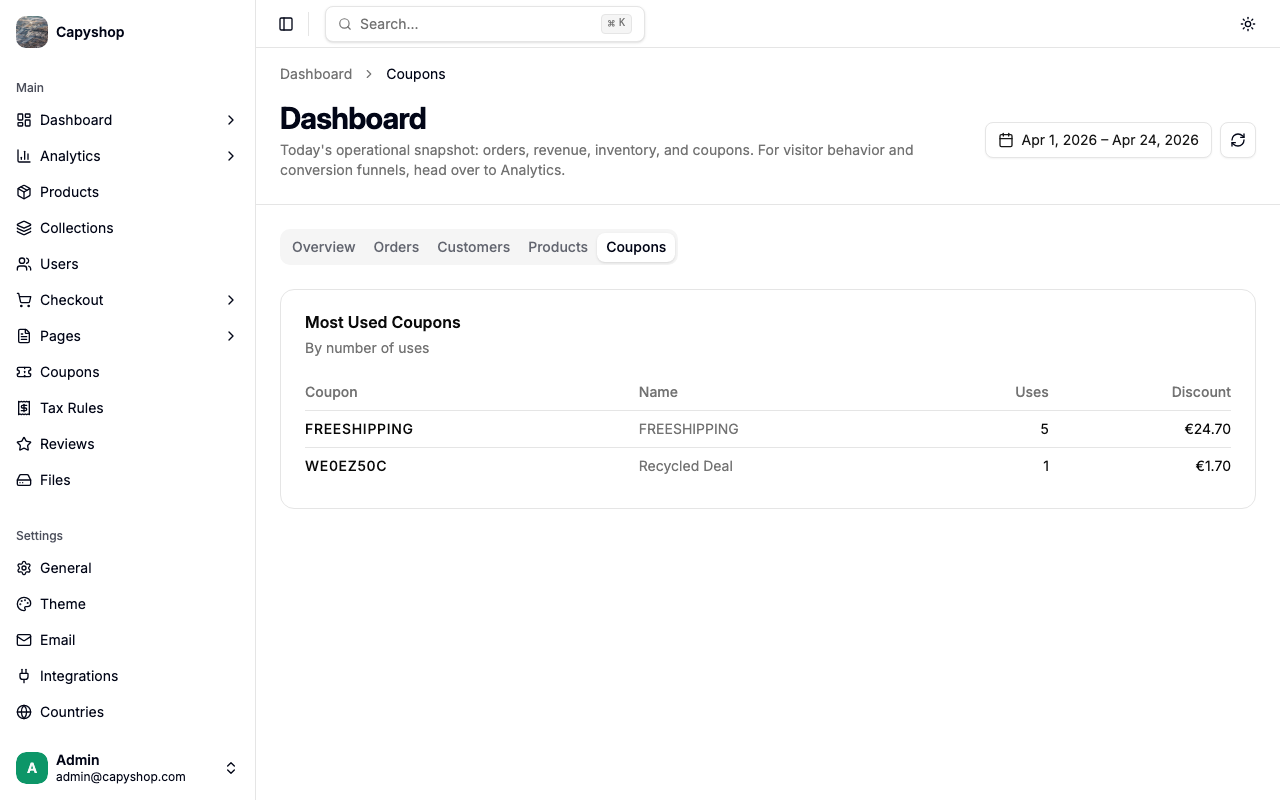
- Most Used Coupons — ranked by usage count within the selected date range, with total discount granted.
This is the quickest way to see whether that holiday promo you ran last week actually moved the needle.
Dashboard vs. Analytics
A quick reference for when to use which:
| Question you are asking | Section |
|---|---|
| "How much did we make yesterday?" | Dashboard → Orders |
| "Which products sold the most this month?" | Dashboard → Products |
| "Did our launch campaign actually bring paying traffic?" | Analytics → Traffic |
| "Where are shoppers dropping off in checkout?" | Analytics → Funnel |
| "Is there stock I need to reorder today?" | Dashboard → Overview |
| "Which abandoned carts should I try to recover?" | Analytics → Abandoned Carts |
Dashboard answers operational questions about your orders. Analytics answers behavioral questions about your visitors.