Appearance
Analytics
Capyshop ships a first-party analytics system out of the box — no Google Analytics, no third-party tracking snippets, no consent-manager integration to maintain. You get visitors, sessions, conversion funnels, traffic sources, product performance, and abandoned-cart insights right from the admin sidebar.
Analytics lives at Analytics in the admin sidebar, separate from Dashboard. Here is a quick way to think about them:
| Section | Focus | Typical question it answers |
|---|---|---|
| Dashboard | Operational snapshot — orders, revenue, inventory, coupons | "How is today / this month going?" |
| Analytics | Visitor behavior and conversion trends — sessions, funnel, traffic sources | "Where do sales come from and why?" |
See the dedicated Dashboard page for the operational side.
Before you begin
A few things are worth knowing before you start comparing numbers:
- Consent-gated by default. Visitor behavior (page views, product views, add-to-cart, etc.) is only tracked once a shopper accepts the cookie consent banner on your storefront. Purchases and abandoned checkouts are always recorded — they are contractual events, not behavioral tracking.
- Admin sessions are excluded. Sessions from signed-in admin users do not contribute to visitors, sessions, page views, or any other metric, so the dashboards reflect real customer activity rather than internal browsing or testing.
- Page paths are normalized. The same logical page is grouped under a single canonical path — e.g. cleaned of tracking-only query parameters — so traffic numbers don't fragment across cosmetic URL variants.
- Fully GDPR-compliant. Capyshop never stores raw IP addresses or User-Agents. Bot traffic is detected and filtered before it ever reaches the database.
- Data refresh cadence is configurable. By default, a background job re-aggregates the last 24 hours of raw events every hour. Your deployment may be tuned differently — the exact cadence for your store is shown right under the "Analytics" heading. You can always pull the latest numbers earlier with the Refresh button.
- Retention is configurable. By default, raw events are kept for 90 days and aggregated daily rollups are kept forever so year-over-year comparisons stay available. Both values can be adjusted per deployment.
The Analytics section
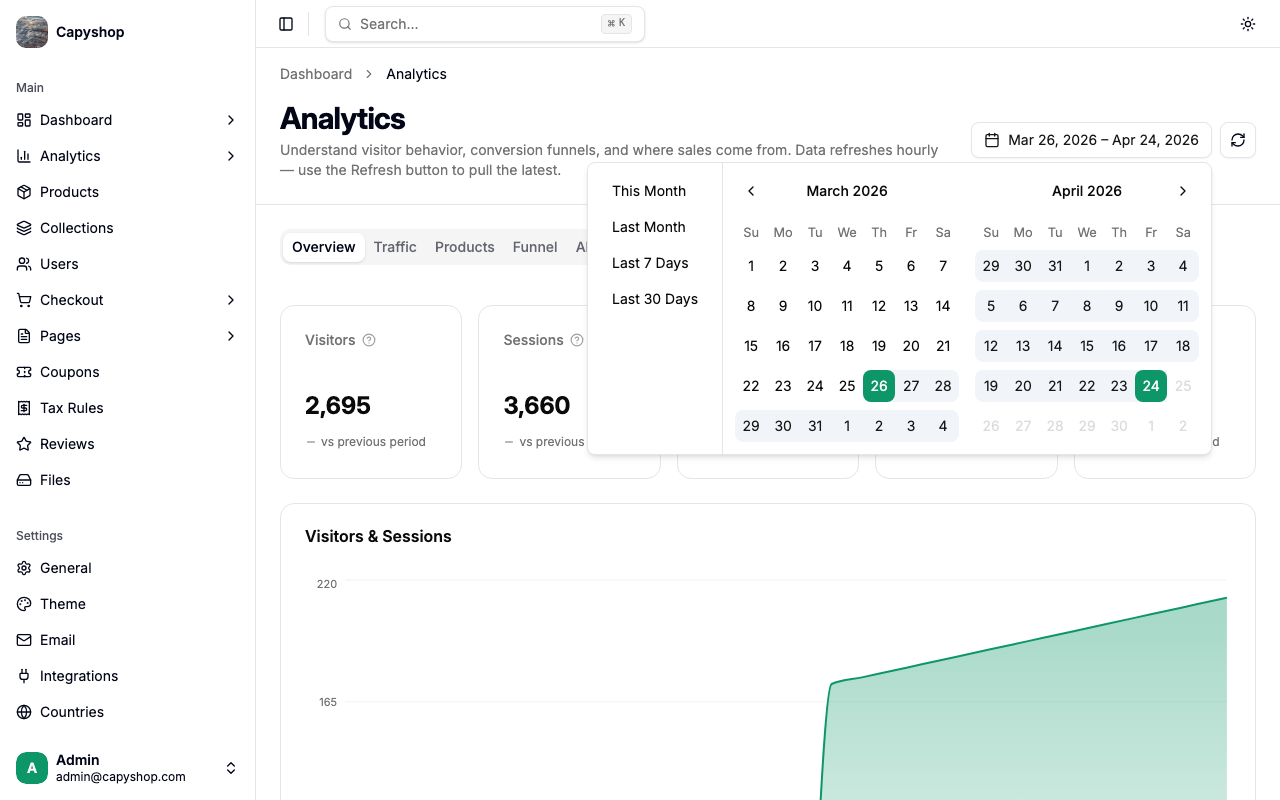
Every tab shares the same header controls:
- Date range picker — defaults to the last 30 days. Click the picker to choose a preset or a custom range.
- Refresh button — re-runs the aggregator server-side. There is a 10-second cooldown between refreshes so a room full of admins can't melt the database.
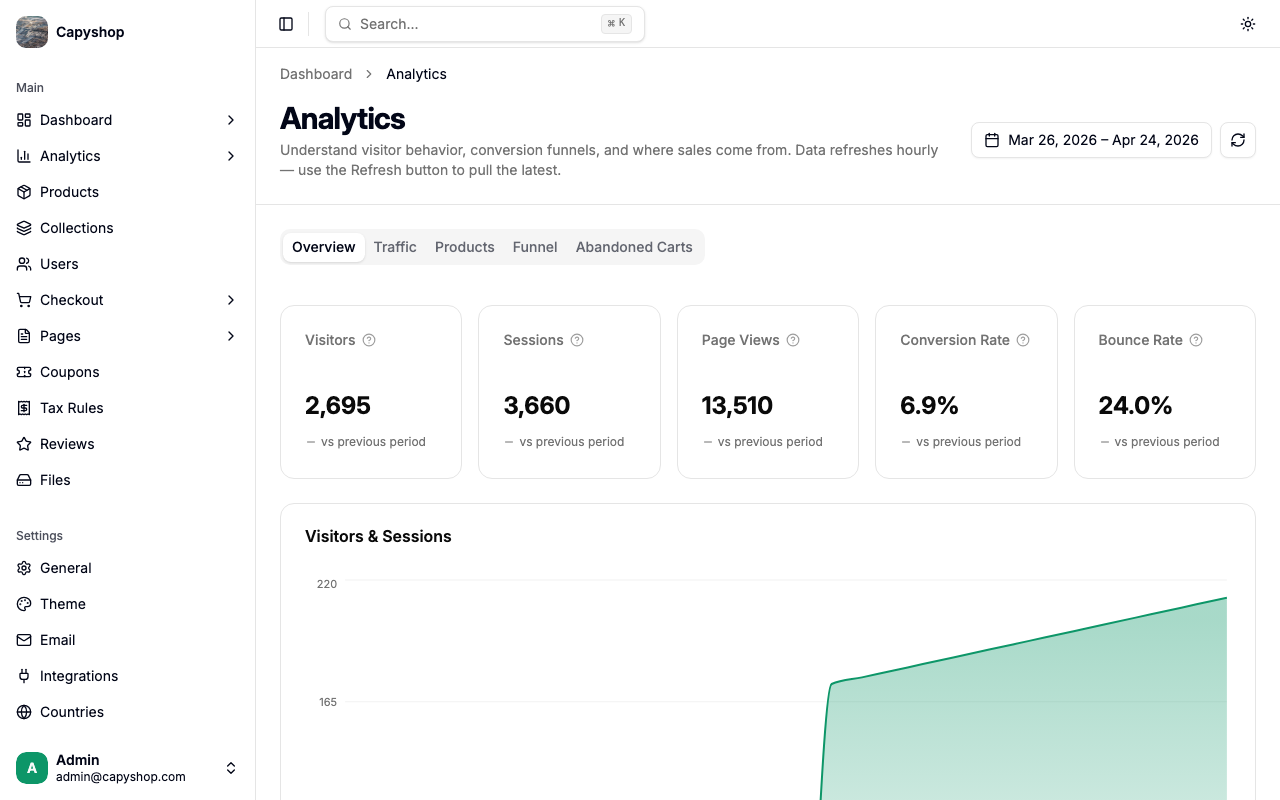
Overview tab
The overview tab gives you the five numbers that matter most, plus a Visitors & Sessions chart over the selected date range.
| KPI | What it means |
|---|---|
| Visitors | Unique people who visited your store in this date range. |
| Sessions | A session is one continuous visit. A visitor can have multiple sessions if they come back later. |
| Page Views | Total pages loaded across all visits. |
| Conversion Rate | Percentage of sessions that ended in a purchase. The single most important number for your store. |
| Bounce Rate | Percentage of sessions where the visitor only saw one page. Lower is better — it means people explore your store. |
Each KPI also shows a "vs previous period" delta once you have enough history. Direction-aware coloring means "conversion rate up 12%" shows in green and "bounce rate up 12%" shows in red. Hover any KPI to see a tooltip explaining how that number is calculated.
Traffic tab
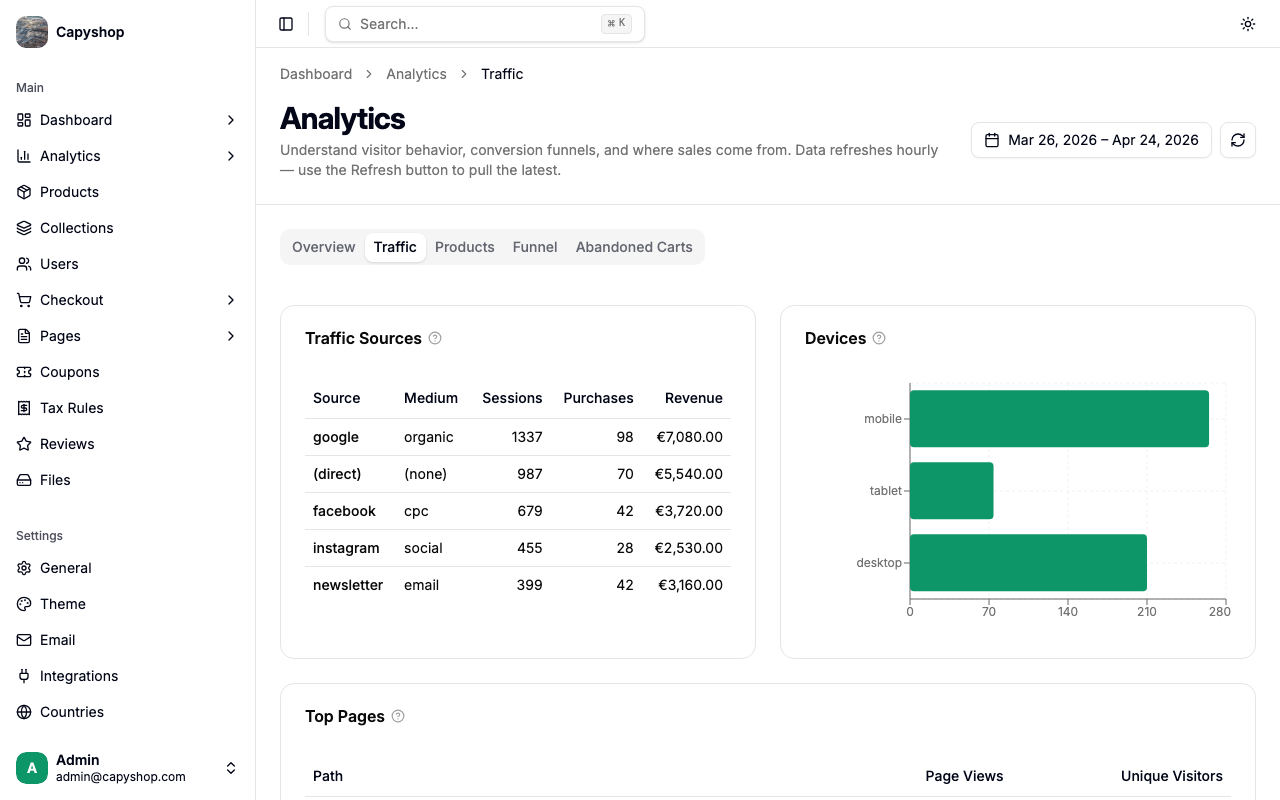
Three sections help you understand where your visitors come from and what they look at:
- Traffic Sources — a table broken down by UTM source and medium (e.g.,
google / organic,facebook / cpc,newsletter / email). Sessions, purchases, and revenue per source. - Devices — horizontal bar chart of sessions by device type (mobile, desktop, tablet). If most of your traffic is mobile, your product pages need to look great on small screens.
- Heatmap — a day-of-week × hour grid showing when sessions actually happen. Use it to time newsletter sends, plan promotions, or schedule maintenance windows for the quietest slots.
- Top Pages — which URLs on your store get the most views, with unique-visitor counts.
Tip: To see which campaigns actually work, tag every marketing link you share with UTM parameters. Capyshop captures them automatically — no configuration needed.
The Traffic Sources, Top Pages, Products, and Abandoned Carts tables all use server-side pagination so large stores stay fast — only the rows you're looking at are loaded at a time.
Products tab
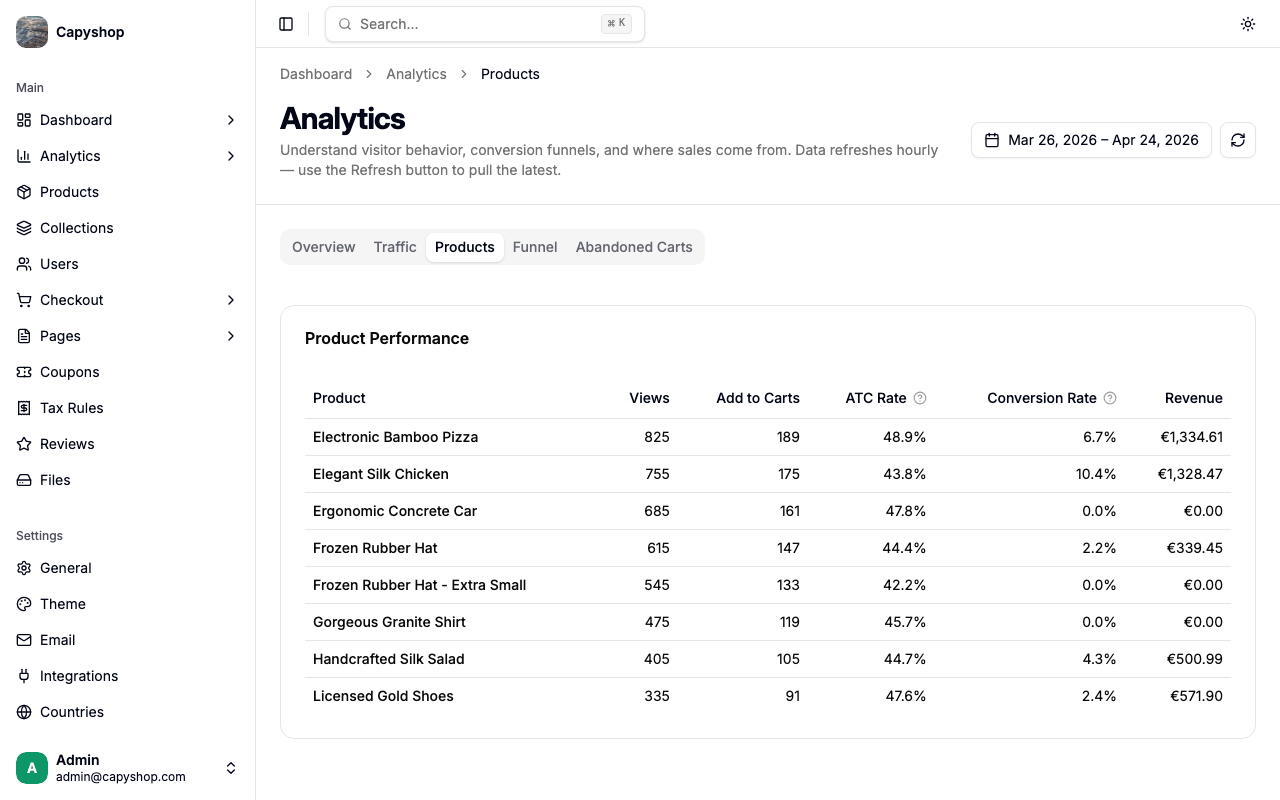
Per-product metrics for your top 50 products by views:
| Column | Meaning |
|---|---|
| Product | Links back to the product edit page for quick fixes. |
| Views | Number of times the product page was opened. |
| Add to Carts | Number of add-to-cart events for this product. |
| ATC Rate | Add-to-cart rate — how often visitors who viewed a product added it to their cart. Spot products that attract clicks but not commitment. |
| Conversion Rate | Of people who viewed this product, what percentage actually bought it. |
| Revenue | Total revenue from this product in the date range. |
Funnel tab
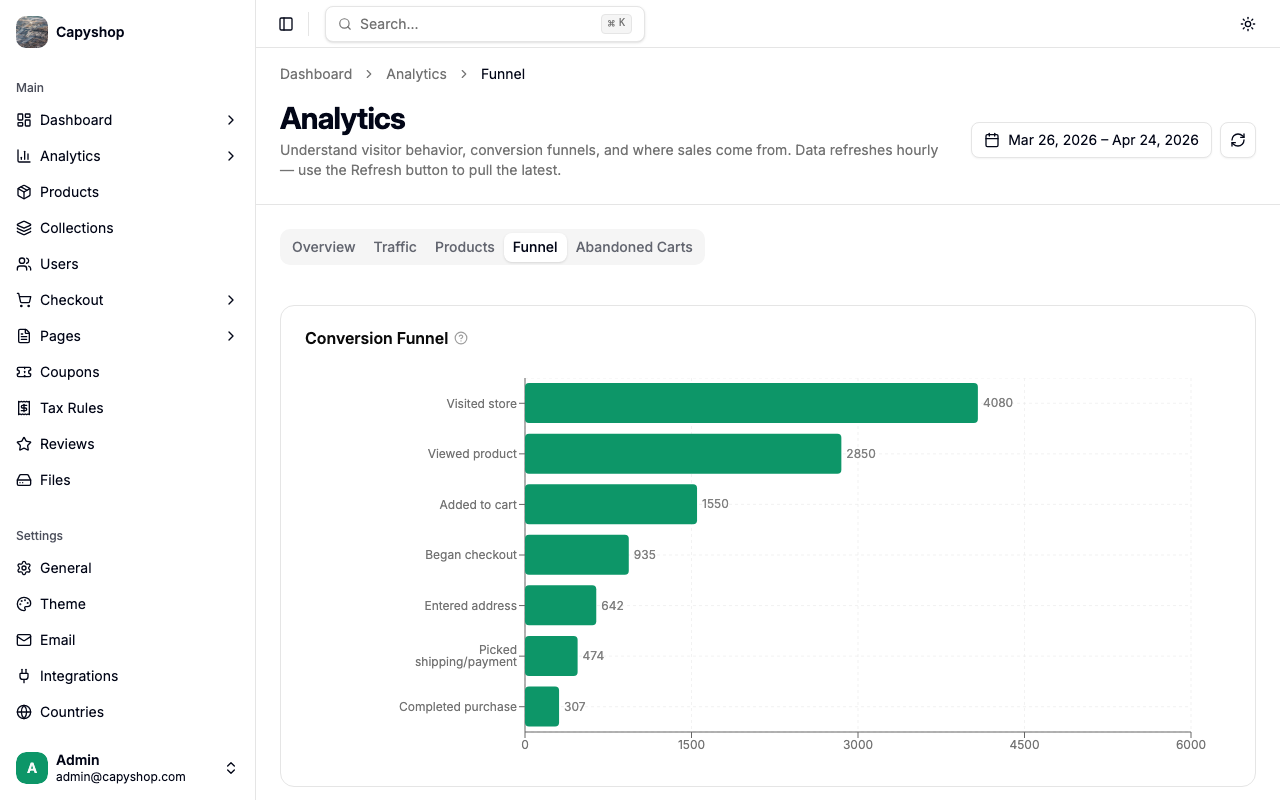
The funnel tab shows how visitors move through the seven-step buying journey:
- Visited store — first page view
- Viewed product — opened any product page
- Added to cart — clicked "Add to cart"
- Began checkout — started the checkout flow
- Entered address — filled in shipping details
- Picked shipping/payment — completed shipping and payment selection
- Completed purchase — order placed
Each step that loses many people is an opportunity to improve. Fix the leakiest step first — the bar chart plus the drop-off list color-code big losses (red when drop is above 30%, amber between 15–30%) so the worst step jumps out immediately.
Abandoned carts tab
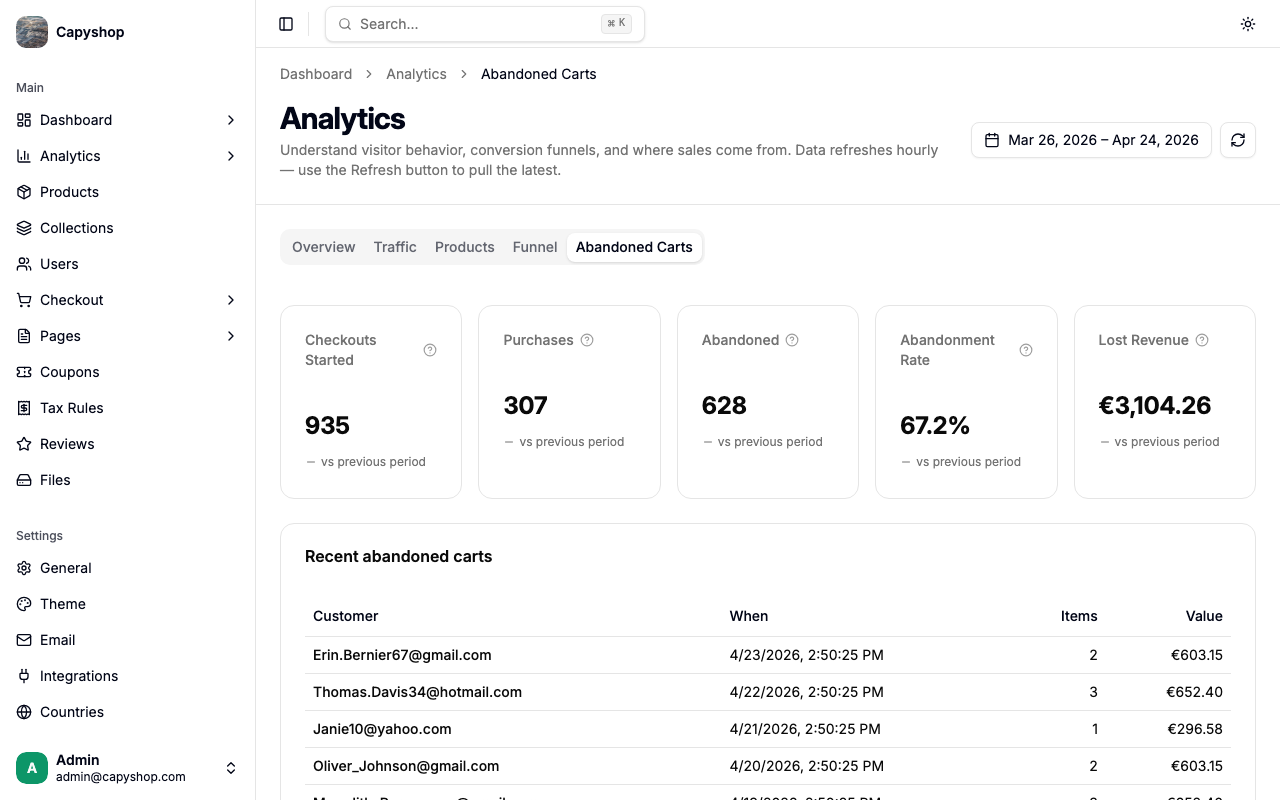
Abandoned carts are checkouts that a shopper started but never completed within 24 hours. Recovering them is often the single biggest quick win for a small store.
| KPI | What it means |
|---|---|
| Checkouts Started | Shoppers who got past the cart and entered the checkout flow. |
| Purchases | Orders successfully placed in this date range. |
| Abandoned | Checkouts that were started but never completed within 24 hours. |
| Abandonment Rate | Percentage of started checkouts that were abandoned. Under 70% is healthy; above 85% suggests real friction at checkout. |
| Lost Revenue | Estimated revenue left on the table from carts that expired without a purchase. |
Below the KPIs, Recent abandoned carts lists each abandoned cart with the customer, when it happened, how many items were in it, and the value. This is your shortlist for recovery campaigns (personal email, retargeting ads, a small discount code).
Coupons tab
The coupons tab measures how each discount code actually performed in the selected date range.
| Column | What it means |
|---|---|
| Code | The coupon code, linking back to the coupon edit page |
| Views | How many times the coupon was surfaced to a shopper (e.g., shown in a Coupon List page section or AI search) |
| Copies | How many times shoppers clicked to copy the code on the storefront |
| Applies | How many times the code was successfully applied at checkout |
| Conversions | Of the carts that applied the code, how many turned into a paid order |
| Revenue | Revenue from orders that used this coupon |
Use this view to spot codes that are widely seen but rarely applied (positioning problem), or applied but rarely converted (the discount isn't enough to push the order through).
Privacy and data retention
Capyshop was built for GDPR from day one:
- No raw IP addresses or User-Agents are stored — only a coarse device type (mobile / desktop / tablet).
- Bot traffic is filtered before it reaches the database, so aggregate numbers reflect real humans.
- Raw event data is kept for 90 days by default (configurable per deployment via
ANALYTICS_RETENTION_DAYS). Aggregated daily rollups are kept forever, so long-term trends remain available without any personal data. - When a customer account is deleted, their associated analytics events are deleted as well — right-to-erasure is covered by the same admin flow as the rest of their data.
If you have specific compliance requirements (extra-short retention, custom purge schedule), the defaults can be tuned per deployment without affecting the dashboards.